figure(1)
t=linspace(0,1);
n=3;
for i=0:n
b=bernstein(n,i,t);
plot(t,b);
hold on;
end
xlabel('t');
ylabel('Polinomio de Bernstein')
title('Polinomios de Bernstein de grado 3');
legend('B_3_,_0','B_3_,_1','B_3_,_2','B_3_,_3')
t=linspace(0,1);
V=[1 2 4 4.6;1 3 -1 1.5];
plot(V(1,:),V(2,:),'-o');
n=size(V);
n=n(2);
s=size(t);
x=zeros(n,s(2));
y=zeros(n,s(2));
for i=1:n
x(i,:)=bernstein(n-1,i-1,t)*V(1,i);
y(i,:)=bernstein(n-1,i-1,t)*V(2,i);
end
a=sum(x);
b=sum(y);
hold on;
plot(a,b);
figure(2)
lect1=xlsread('sotaventogaliciaanual.xlsx');
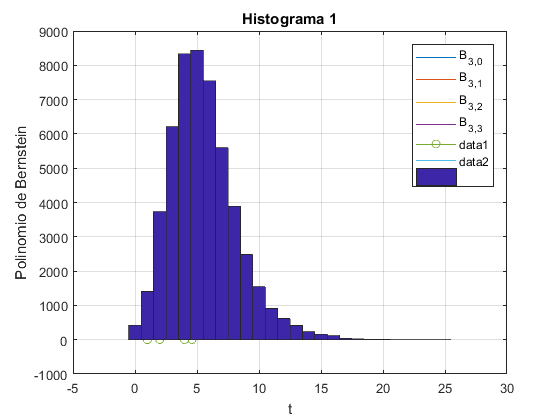
int1=0:25;
figure(1)
hist(lect1(:,1),int1);grid on
title('Histograma 1');
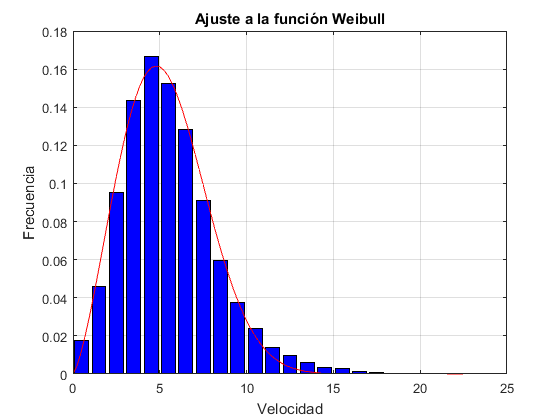
lect1=xlsread('sotaventogaliciaanual.xlsx');
velocidad=lect1(:,1);
x=0.5:1:max(velocidad);
horas=hist(velocidad,x);
frec=horas/sum(horas);
modelfunc=@(a,x) (a(1)/a(2))*((x/a(2)).^(a(1)-1)).*exp(-(x/a(2)).^a(1));
beta0=[mean(velocidad) std(velocidad)];
beta=nlinfit(x,frec,modelfunc,beta0);
figure(2)
bar(x,frec,'b');grid on;hold on
x=linspace(0,max(velocidad),100);
y=modelfunc(beta,x);
plot(x,y,'r')
title('Ajuste a la función Weibull')
xlabel('Velocidad')
ylabel('Frecuencia')
hold off
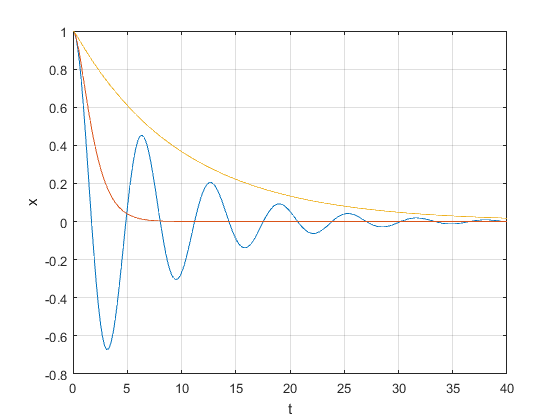
figure(3)
m=20;
k=20;
xv0=[1,0];
tf=40;
c1=5;
c2=40;
c3=200;
f1=@(t,x) [x(2);(-k*x(1)-c1*x(2))/m];
f2=@(t,x) [x(2);(-k*x(1)-c2*x(2))/m];
f3=@(t,x) [x(2);(-k*x(1)-c3*x(2))/m];
[t1,x1]=ode45(f1,[0,tf],xv0);
[t2,x2]=ode45(f2,[0,tf],xv0);
[t3,x3]=ode45(f3,[0,tf],xv0);
plot(t1,x1(:,1),t2,x2(:,1),t3,x3(:,1));
grid on
xlabel('t');
ylabel('x');